The Only 6 Metrics You Need for Your Business Case
Customer segments, ARPU, Margin
One of the key activities in developing new products and planning a business strategy is to develop a solid and realistic business case. Not only will a business case help to calculate what is a realistic expectation for your product, it also serves as a means of communication to senior management. A business case also helps to brings some common sense to any strategic discussion. I’ve been in many meetings where business developers believe something is a great idea, and will bring in millions of euros. However, once you starting calculating a business case for a new product it quickly puts you back with your feet on the ground.
In this article I’ll show you how you can develop a business case by defining the following six metrics: (1) Customer segments, (2) ARPU, (3) Margin, (4) NDR, (5) Churn, (6) Customer base
Making a business can be complicated. Especially when you are drilling down to the nitty-gritty details you can easily become overburdened with numbers, relationships, percentages and ratios. Experience has shown though that also for creating a business case we can apply a rule of 80–20: You can get it 80% right in 20% of the time. The other 80% of your time you can dedicate to figuring out the exact details. With the simple method below I will help you to get that first 80% structured.
Please take into account that this method for calculating a business case primarily applies to products where people have a recurring buying pattern. This can be a monthly fee to a software subscription, or insurance, a regular buying pattern such as grocery shopping, or seasonality of buying clothes. This method is not suited for peak buying moments such as buying a house or car, installing a kitchen or purchase of long lifetime appliances (washing machine, dryer, etc).
Preparing your business case
Customer segment
The first thing you should specify is which customer segments there are in your customer base. If you don’t have an existing customer base, then you should identify how many potential customers there are in your target market and what the segments are in that market that you want to target.
The essence of a customer segment is that you can serve that segment with at least one product. Think for example Netflix that offers various packages: on the low end a package for 1 account, 1 screen, HD quality, on the high end a package for multiple accounts, 4 screens and 4K quality. Or Spotify has two clear segments: 1 account for €/$9,99 a month or a family account for €/$ 14,99 a month. You could say that each package represents a customer segment that you want to address. The first step is to identify how you want to segment your customers. A general advice is to keep the number of customer segments low. Typically you’ll want to have around 3 customer segments. If you go above 10 customer segments you’ll want to group some segments together.
Once you have identified your customer segments it is important to specify how much of your customer base they represent. For example, Spotify might know that about 75% of their customers have a single account and 25% of their customers have a family account. Your total customer segments should always sum up to 100%.

Recurring revenue: ARPU/MRR
The second key metric to determine is the recurring revenue that you generate for each customer segment. You can either base this on historical data that you may have about your customer base. You can also determine it on market research that you have done.
There are two important terms you should know: average revenue per user ARPU or monthly recurring revenue MRR. It doesn’t really matter which of the two you choose, they indicate more or less the same thing. I have a slight preference for ARPU as you can determine the timeframe by yourself. It is important to take the time frame into account as that will determine how you have to project your organic growth and/or loss. With MRR you pin yourself down to a monthly timeframe, which may not always be fitting for your business. (You might offer discounts to people that pay annually upfront, for example).
Determine for each of your customer segments what the average revenue is.

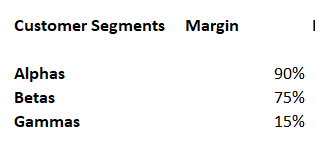
Margin
The third important metric to identify is the margin that you expect to make for each customer segment. Why would you pick margin instead of specifying cost and/or selling price? Well, your margin is a result of the difference between your fixed and variable cost for a product and the price for which you sell the product. Determining all those variables can be a daunting task. And it may lead to unwanted discussions. By picking only the margin you abstract the complexity away. You take the outcome of a complex calculation into a single figure that you can user for further calculation. How that figure eventually is constructed is less relevant at this stage. Most people are perfectly well capable to make an educated guess of a realistic margin value.
The other benefit of a margin is that it sets out the ambition for your business. If you are currently running at a margin of 20% and you specify a target margin of 30% it means that you see opportunities to improve. It is valuable to share where you see room to improve.
Specify for each customer segment what the expected or desired margin is.
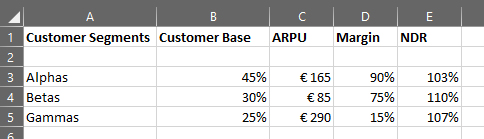
Organic growth: Net Dollar Retention (NDR)
Succesful products and companies grow naturally with their customer base. If customers enjoy using your product they may start using it more. Or they might upgrade to a higher tier. Or you might simply increase your prices. This growth of your existing customer base is called organic growth and can be captured in your Net Dollar Retention or NDR. This value is a percentage, for example 105%. It means that a customer that is worth €100 this year, is worth €105 next year and €110,25 (105% of 105) the year after. Basically: if you don’t attract new customers you can expect to grow with this number.
We again flatten this to a single number, instead of defining where this growth is coming from. The same reasoning applied here: you don’t want to focus on how exactly this NDR is composed, but you are mostly interested in the growth itself.
As a fourth step specify the value that you expect for each customer segment. Take care that some customer segments may grow and cannibalize your other segments. For example a Spotify customer that upgrades to a family account grows one year, but is then in another segment and doesn’t grow from there in the second year.
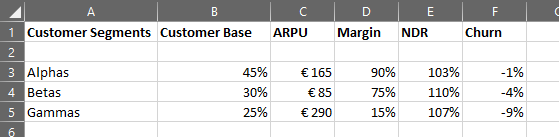
Organic loss: Churn
In the same way that your existing customers gain in value, another part of your customers will stop using your product, or downgrade to a lower tier. This is called churn and can also be expressed as a percentage. For example a churn rare of 4% means that your existing customer base will be worth 4% less next year.
As a last step identify the churn rate that you expect for each customer segment.
Calculate your business case
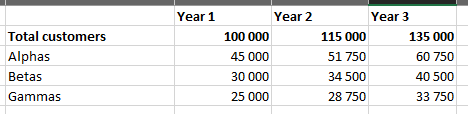
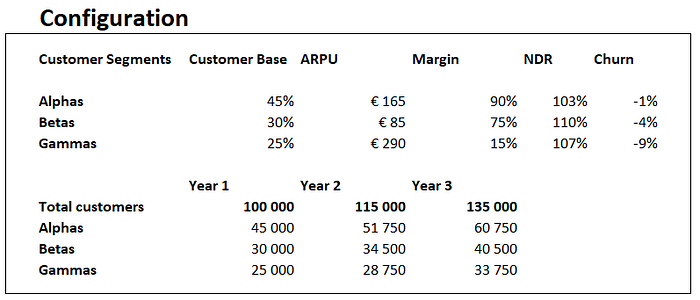
The first step to calculate your business case is to determine how many customers you have, or expect to have. In a regular business case this is something that you know, is set out as an ambition, or can be determined based on market knowledge.
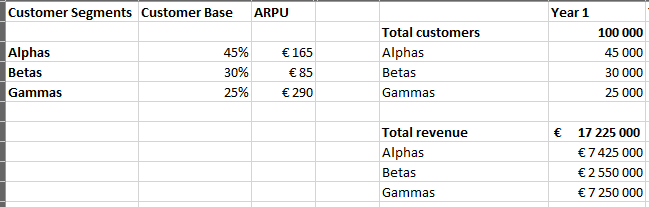
For our example we expect to have 100k existing customers (for example for an existing product), which we grow with 15k in the first year and 20k in the second year.
We have now defined all of our parameters to run our analysis. The rest of the business case is just setting up your calculations!
Step 1: Calculate the total revenue for the first year with your ARPU
For the first year you can easily multiply the amount of customers in a segment by the ARPU. That will give you the Total expected revenue for the first year, split per customer segment. The formula to calculate your total revenue is:
customers x ARPU
(Keep in mind that you calculate this per customer segment, because we use different ARPU per customer segment)
But now it gets interesting! You can now also compute your expected revenue for the second and third year and even split it per customer segment. Read along to see how to do this.
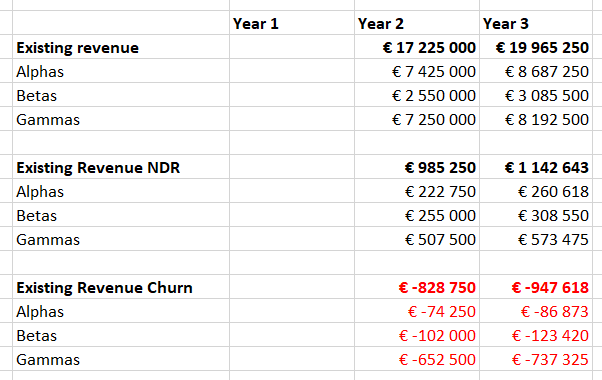
Step 2: Compute the NDR and Churn for your customers
To calculate the NDR for your customer you multiply the percentage above 100% by the revenue of the first year for that segment. That will give you the expected additional revenue compared to the first year. The formula to calculate your NDR is:
total revenue year 1 x (NDR% - 100%)
In the same way you can also calculate the Churn value. Multiply the existing revenue by the Churn % and you will see how much value you can expect to lose in your existing customer base. The formula to calculate your Churn is:
total revenue year 1 x churn%
Keep in mind that you should calculate your NDR and churn for the third year on the total revenue of the second year!
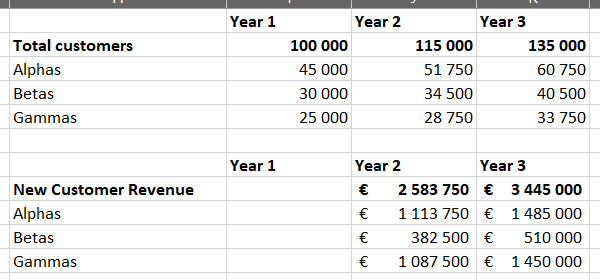
Step 3: Compute the additional revenue from new customers
As a next step you need to calculate your new customers in the second year and the contribution they have to the total revenue. Multiply the number of new customers with the ARPU. Since these customers are new, you should exclude them from the NDR and Churn calculation. The formula to calculate the revenue from new customers is:
(customers year 2 - customers year 1) x ARPU
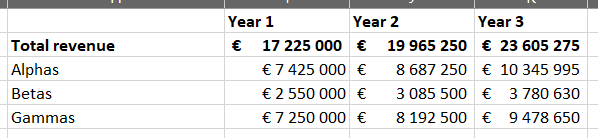
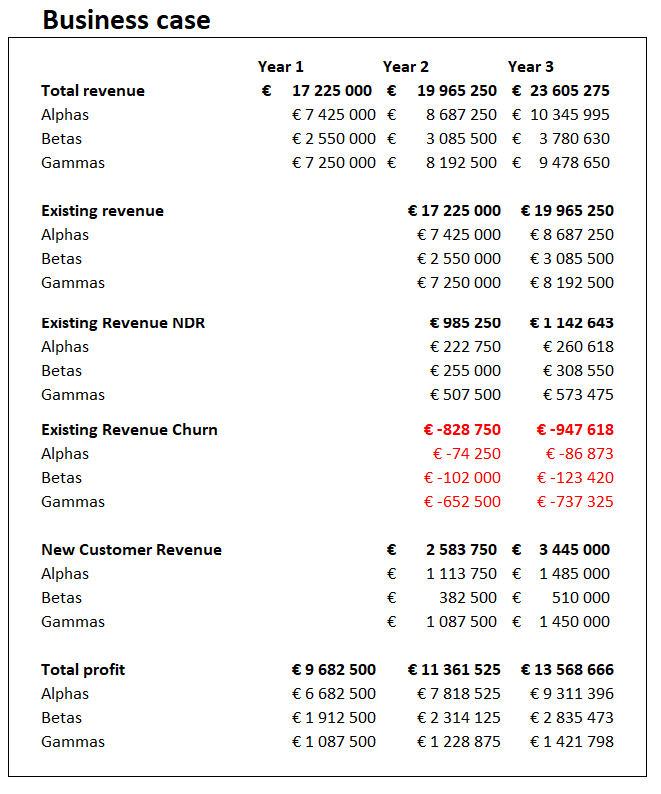
Step 4: Compute the total revenue
Now that you have all the basic components to estimate the revenue in your second year. You now combine the revenue of your existing customers and their NDR and Churn with the revenue of your new customers. The formula to calculate the total revenue is rather straightforward.
existing revenue + existing revenue NDR + existing revenue Churn + new customer revenue
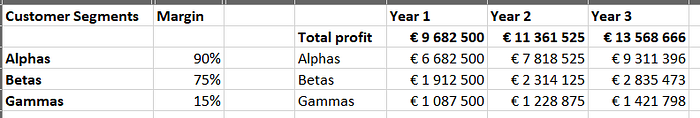
Step 5: Compute your profit based on your margin
The last step to complete your business case is to calculate the profit for each of the customer segments based on their respective margins. You calculate your profit by multiplying the revenue per customer segment with the margin that you make on that customer segment. The formula to calculate the profit is:
revenue x margin
NB: Please keep in mind that we are talking about product profit here, not your profit as a whole organization. The product profit will only take into account the costs that you have to deliver the product, but excludes general overhead costs for the organization.
You now have your full business case calculated!
Run your analysis
You now have all information ready to run the analysis for your business case. Always keep in mind that creating a business case is as much a process as it is a deliverable. The process of calculating the figures, tweaking the percentages will provide you with valuable insights on where you can grow your business, and what actually has the largest potential for optimization! See for yourself whether it is better to increase prices or to reduce your margins somewhere.
Get more granular
Now that you have the foundation of your business case ready you can get more granular. Here are some ideas on how to make the business case more granular:
- Specify your key metrics per year. This will help you to plot where you want to focus your improvements.
- Split out the segment ratio per year. In this way you can clarify how the different segments should grow.
- Make it visual. You now have the key datapoint. It’s easy to plot them in a graph where you for example offset revenue vs. profit for the segments.
Why use these 6 metrics?
Why would you use these 6 metrics and not some other metrics? You’ve probably seen business cases elsewhere that are computed with a lot of variables. I would recommend to use these 6 metrics as (1) they are easy to calculate based on historical data, (2) are easy to measure in the future and (3) there are benchmark values to be found in analyst and marketing reports for competing businesses.
If you are running an existing business then you have a ton of data available. Using historical data to do future business planning can be a useful method to validate your business case. It is unrealistic to expect a dramatic change in a running business in a year. Try to follow the trend you see in the data, and extrapolate from there.
As you are executing your business plan you should periodically check whether you are executing according to plan. This will help you to adjust where necessary on time.
If you don’t have any historical data you may also extract data from competitor or adjacent businesses. You can find this information in analyst reports, but many of these metrics will also be report in annual reports. See if you can find those numbers to verify whether the numbers you have assumed or planned are realistic.
In this article I’ve describe how to build a business case for a new product or service using only 6 key metrics (customer segment, ARPU, NDR, Churn, margin and customer base).
Enjoyed this article? Other recommended articles
About the author
Remco Magielse is a product manager at CM.com. CM.com is a high tech company focusing on CPaaS Conversational Commerce in The Netherlands. He has worked as a system engineer and product manager at Philips Hue. Remco has gained his Ph.D. on the dissertation titled ‘How to design for adaptive lighting environments: Embracing complexity in design’. He writes articles about product and software development, and the hard- and soft-skill required for product management. He is passionate about innovation and has contributed to approximately 50 patents.
